CONT+CyA+FCCP.csv
CONT+FCCP.csv
H2O2_24hr+FCCP.csv
H2O2_72hr+CyA+FCCP.csv
H2O2_72hr+FCCP.csv
ĎŔʸşîŔ®»ţ¤ÎR¤Ç¤ÎĄ°ĄéĄŐÉÁ˛čÎ㡣gplots¤ÎplotCI¤ČmatrixStats¤Î´Řżô¤ň»Č¤Ă¤żÎ㡣
# install.packages("gplots", dependencies = TRUE)
# install.packages("matrixStats", dependencies = TRUE)
library(gplots)
library(matrixStats)
cls <- function(){ while(dev.cur() > 1) {dev.off()} }
cls()
par_set <- function(){
par(pin=c(4.3, 4.3))
par(mai=c(1,1,0.5,0.5)) $ BLUR
par(ps=13)
}
c1 <- read.table("CONT+FCCP.csv",sep=",")
c2 <- read.table("H2O2_24hr+FCCP.csv",sep=",")
c3 <- read.table("H2O2_72hr+FCCP.csv",sep=",")
c1a<- read.table("CONT+CyA+FCCP.csv",sep=",")
c3a<- read.table("H2O2_72hr+CyA+FCCP.csv",sep=",")
par_set()
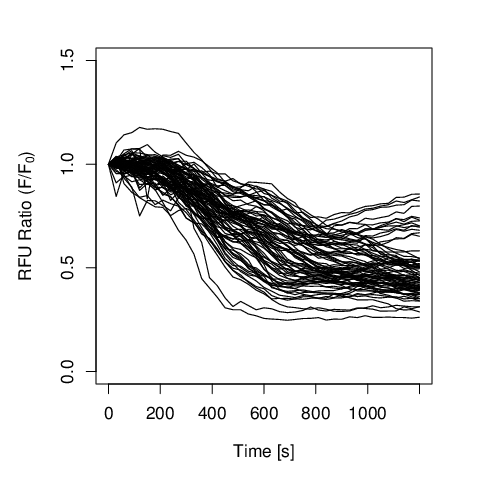
matplot(c1[2:42,1],c1[2:42,2:79],xlim=c(0,1200),ylim=c(0.0,1.5),type="l",col=1,lwd=1,lty=1,ylab=expression(paste(paste("RFU Ratio (F/",F[0]),")")),xlab="Time [s]")
dev.copy2eps(device=postscript, file="CONT+FCCP.eps", width=5, height=5, family="Helvetica")
cls()
par_set()
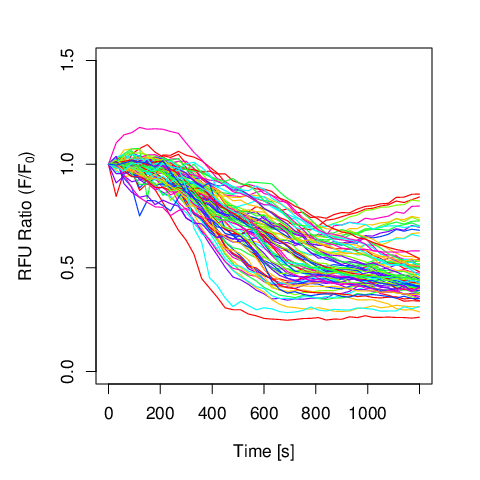
matplot(c1[2:42,1],c1[2:42,2:79],xlim=c(0,1200),ylim=c(0.0,1.5),type="l",col=rainbow(8),lwd=1,lty=1,ylab=expression(paste(paste("RFU Ratio (F/",F[0]),")")),xlab="Time [s]")
dev.copy2eps(device=postscript, file="CONT+FCCP_color.eps", width=5, height=5, family="Helvetica")
cls()
	  par_set()
	  matplot(c1[2:42,1],c1[2:42,2:79],xlim=c(0,1200),ylim=c(0.0,1.5),type="l",col=rainbow(8),lwd=1,lty=1,ylab=expression(paste(paste("RFU Ratio (F/",F[0]),")")),xlab="Time [s]")
	  dev.copy2eps(device=postscript, file="CONT+FCCP_color.eps", width=5, height=5, family="Helvetica")
	  cls()
˛ĽÉդʸ»ú¤Ďexpression()»Č¤¦¤ČÎɤ¤ˇŁ
par_set()
par(ps=12)
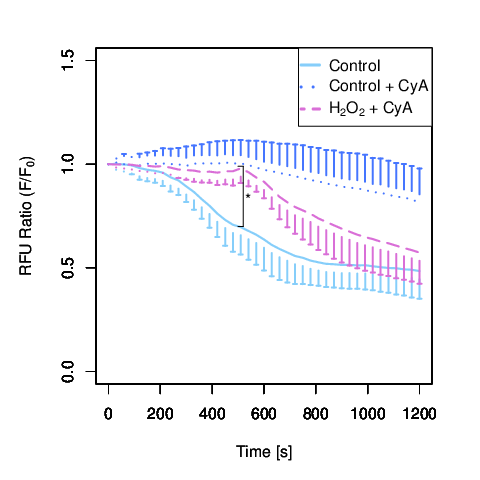
matplot(c1[2:42,1],rowMeans(c1[2:42,2:79]),xlim=c(0,1200),ylim=c(0.0,1.5),type="l",col="lightskyblue",lwd=2,lty=1,xlab="",ylab="")
par(new=T)
plotCI(as.numeric(data.matrix(c1[2:42,1])),rowMeans(c1[2:42,2:79]),xlim=c(0,1200),ylim=c(0.0,1.5),type=NA,lwd=2,col="lightskyblue",liw=rowSds(data.matrix(c1[2:42,2:79])),uiw=NULL,xlab="",ylab="",sfrac=0.003)
par(new=T)
matplot(c1a[2:42,1],rowMeans(c1a[2:42,2:50]),xlim=c(0,1200),ylim=c(0.0,1.5),type="l",col="royalblue1",lwd=2,lty=3,ylab=expression(paste(paste("RFU Ratio (F/",F[0]),")")),xlab="Time [s]")
par(new=T)
plotCI(as.numeric(data.matrix(c1a[2:42,1])),rowMeans(c1a[2:42,2:50]),xlim=c(0,1200),ylim=c(0.0,1.5),type=NA,lwd=2,col="royalblue1",uiw=rowSds(data.matrix(c1a[2:42,2:50])),liw=NULL,xlab="",ylab="",sfrac=0.003)
par(new=T)
matplot(c3a[2:42,1],rowMeans(c3a[2:42,2:60]),xlim=c(0,1200),ylim=c(0.0,1.5),type="l",col="orchid",lwd=2,lty=5,ylab=expression(paste(paste("RFU Ratio (F/",F[0]),")")),xlab="Time [s]")
par(new=T)
plotCI(as.numeric(data.matrix(c3a[2:42,1])),rowMeans(c3a[2:42,2:60]),xlim=c(0,1200),ylim=c(0.0,1.5),type=NA,lwd=2,col="orchid",liw=rowSds(data.matrix(c3a[2:42,2:60])),uiw=NULL,xlab="",ylab="",sfrac=0.003)
legend("topright", legend = c("Control", "Control + CyA", expression(paste("", paste(paste(H[2],O[2])," + CyA"))) ),
pch = "", lwd= c(3,3,3), lty = c(1,3,6), bg="white", y.intersp=1.8, text.width=strwidth("Control + CyA")*1.6, col=c("lightskyblue","royalblue1","orchid"))
segments(500,0.7, 520,0.7)
segments(500,0.99, 520,0.99)
segments(520,0.99, 520,0.7)
text(525,0.82, "*", pos=4, cex=1, offset=0)
dev.copy2eps(device=postscript, file="CONT_H2O2_CyA_color_rev.eps", width=5, height=5, family="Helvetica")
cls()
°ěČĚĹŞ¤Ë¤Ďarrows()¤ň»Č¤¦ˇŁÍ°Őşą¤ňĽ¨¤ąËŔ¤ĎÄ´Ŕ°¤·¤Ę¤¤¤Č¤¤¤±¤Ę¤¤¤ł¤Č¤¬Âż¤¤ˇŁşŁ˛ó¤ĎĽ«Á°¤Çdrawbraced()¤ňşî¤Ă¤ĆÂн褷¤żˇŁ
par_set()
par(pin=c(3.3, 4.3))
par(mai=c(1,1,0.5,0.5)) $ BLUR
par(mar=c(3,5,1,1)) $ BLUR
c1n_v <- unlist(c1[42:42,2:79],use.names=F)
c1a_v <- unlist(c1a[42:42,2:50],use.names=F)
c2n_v <- unlist(c2[42:42,2:46],use.names=F)
c3n_v <- unlist(c3[42:42,2:64],use.names=F)
c3a_v <- unlist(c3a[42:42,2:60],use.names=F)
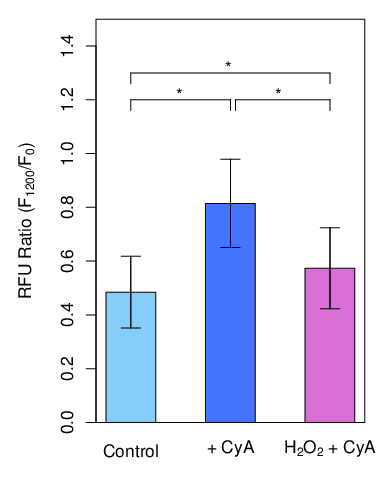
t.test(c1n_v, c3a_v,var.equal=F)
t.test(c1a_v, c3a_v,var.equal=F)
t.test(c1n_v, c1a_v,var.equal=F)
mean_v <- c(mean(c1n_v),mean(c1a_v),mean(c3a_v))
stde_v <- c(sd(c1n_v),sd(c1a_v),sd(c3a_v))
B <- barplot(mean_v, ylim=c(0.0,1.5), ,ylab=expression( paste(paste(paste(paste("RFU Ratio (", F[1200]),"/"),F[0]),")") ), space=1, col=c("lightskyblue","royalblue1","orchid"),
names.arg=c("Control","+ CyA", expression(paste(paste(H[2],O[2])," + CyA"))), xpd=F)
arrows(B, mean_v - stde_v, B, mean_v + stde_v, angle = 90, length = 0.1)
arrows(B, mean_v + stde_v, B, mean_v - stde_v, angle = 90, length = 0.1)
box("plot",lty=1)
drawbraced <- function(x1,x2,y) {
segments(x1,y, x2,y)
segments(x1,y, x1,y-0.04)
segments(x2,y, x2,y-0.04)
}
drawbraced(1.5,3.5,1.2)
text(2.4,1.21, "*", pos=4, cex=1, offset=0)
drawbraced(3.6,5.5,1.2)
text(4.4,1.21, "*", pos=4, cex=1, offset=0)
drawbraced(1.5,5.5,1.3)
text(3.4,1.31, "*", pos=4, cex=1, offset=0)
dev.copy2eps(device=postscript, file="CONT+H2O2_BARPLOT_color.eps", width=4, height=5, family="Helvetica")
cls()
Phoebe: Y'know I had a dream where Ross and Rachel were still together, they
never broke up. And we were all just like hanging out, and everyone was
happy….
Joey: I had the same dream!
Phoebe: Yeah, and nobody slept with that Xerox girl.
Joey: Oh, I had the opposite dream.
-- David Crane & Marta Kauffman
-- "Friends" (T.V. Show) ( http://en.wikipedia.org/wiki/Friends )
Chuck Norris doesn't commit changes, the changes commit for him.
-- Araujo
-- Chuck
Norris Facts by Shlomi Fish and Friends ( http://www.shlomifish.org/humour/bits/facts/Chuck-Norris/ )